Analyzing Blockchain TVL Trends with Python: A Deep Dive into DeFi Data

Analyzing Blockchain TVL Trends with Python: A Deep Dive into DeFi Data
In the ever-evolving world of decentralized finance (DeFi), staying on top of market trends is crucial. One key metric that DeFi enthusiasts and analysts keep a close eye on is Total Value Locked (TVL). Today, we'll explore a Python script that fetches, processes, and visualizes TVL data for various blockchain networks, with a particular focus on trend analysis using Exponential Moving Average (EMA).
The script we're examining leverages several powerful Python libraries and APIs to create a comprehensive tool for TVL analysis. Let's break down the key components and concepts:
- Data Retrieval:
The script uses the DeFi Llama API to fetch historical TVL data for a specified blockchain. This API is a valuable resource for DeFi data analysis:
def defi_lama_tvl_trend(chain='solana', alpha=0.3, plot=False):
    url = f"https://api.llama.fi/v2/historicalChainTvl/{chain}"
    response = requests.get(url)
    data = response.json()
- Exponential Moving Average (EMA) Calculation:
One of the most interesting aspects of this script is its implementation of the EMA. The EMA is a type of moving average that gives more weight to recent data points, making it responsive to new information:
def calculate_ema(data, alpha=0.3):
    tvls = [entry["tvl"] for entry in data]
    ema = [tvls[0]]
    for i in range(1, len(tvls)):
        ema.append(alpha * tvls[i] + (1 - alpha) * ema[i - 1])
    return ema
The alpha parameter determines the degree of weighting decrease. A higher alpha discounts older observations faster.
- Data Processing and Visualization:
The script uses pandas for data manipulation and matplotlib for visualization. It creates a DataFrame with the raw TVL data and the calculated EMA, then plots both series:
df = pd.DataFrame({'Date': dates, 'TVL': tvls, 'EMA': ema})
if plot:
plt.figure(figsize=(15, 6))
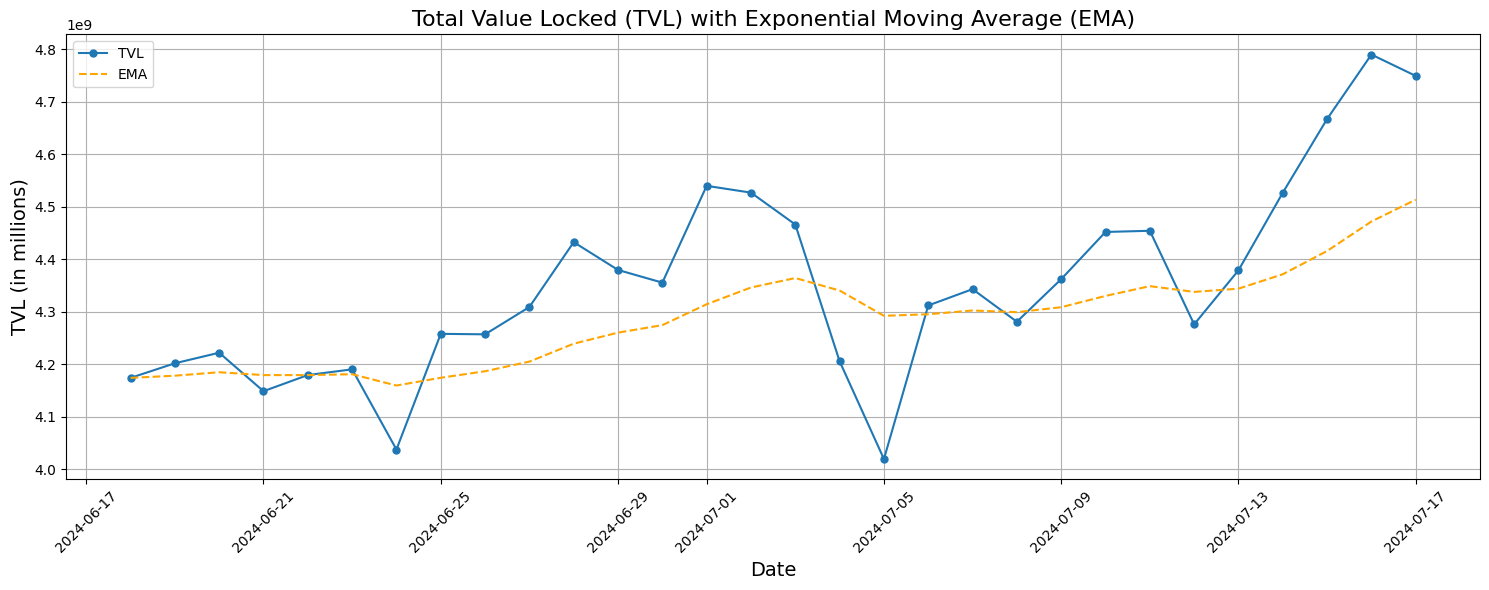
plt.plot(dates, tvls, label='TVL', marker='o', markersize=5)
plt.plot(dates, ema, label='EMA', linestyle='--', color='orange')
# ... (additional plotting code)
This visualization allows for easy comparison between the actual TVL and its trend as represented by the EMA.
- Trend Analysis:
The script's primary output is a boolean indicating whether the current TVL is above its EMA, suggesting an upward trend:
return df['TVL'].iloc[-1] > df['EMA'].iloc[-1]
This simple yet effective comparison can be a valuable signal for trend direction.
What makes this script particularly interesting is its flexibility and potential for expansion. Here are a few ways it could be enhanced:
- Multi-chain Comparison: The script could be easily modified to compare TVL trends across multiple blockchains simultaneously.
- Additional Technical Indicators: Alongside the EMA, other technical indicators like the Relative Strength Index (RSI) or Moving Average Convergence Divergence (MACD) could be implemented to provide a more comprehensive analysis.
- Automated Alerts: By scheduling this script to run periodically, it could be used to generate alerts when certain TVL conditions are met, such as when the TVL crosses above or below its EMA.
- Historical Backtesting: The script could be extended to backtest the effectiveness of using EMA crossovers as a signal for predicting future TVL movements.
- Integration with DeFi Protocols: For more advanced applications, this analysis could be integrated with smart contract interactions to automate investment strategies based on TVL trends.
In conclusion, this Python script serves as an excellent starting point for anyone interested in programmatically analyzing DeFi trends. It demonstrates the power of combining financial APIs, data processing libraries, and visualization tools to gain insights into the dynamic world of decentralized finance. Whether you're a DeFi enthusiast, a data scientist, or a blockchain developer, understanding and expanding upon these concepts can open up a world of possibilities for quantitative analysis in the crypto space.
Remember, while tools like this can provide valuable insights, they should always be used in conjunction with other forms of analysis and research when making financial decisions in the volatile world of cryptocurrency and DeFi.